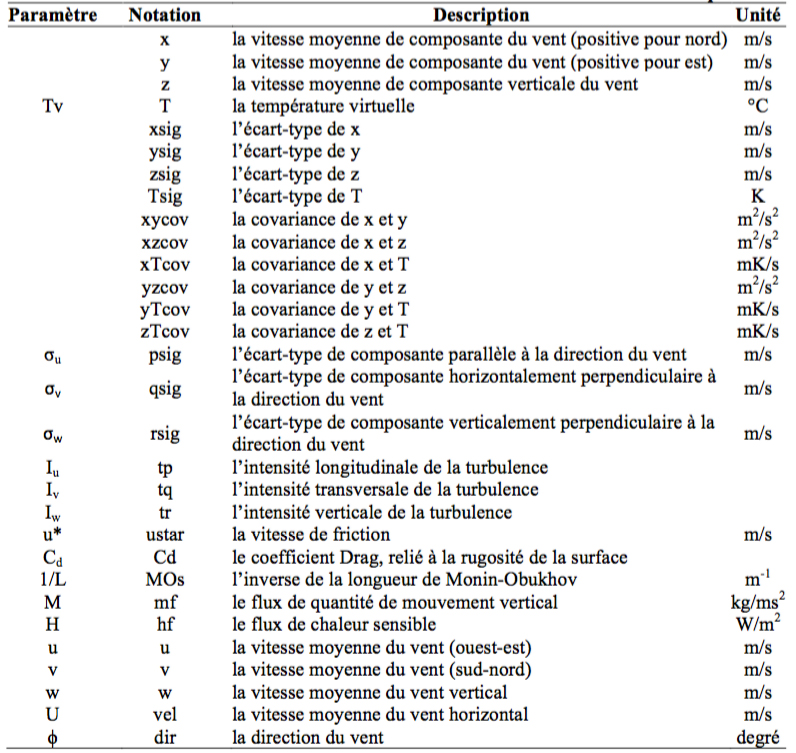
Leosphere Aerosol LIDAR ALS300 (UV)
This angular lidar allows the vertical structure and optical properties of the troposphere to the lower stratosphere to be studied in real time. It is an active remote sensing device, equipped with a pulsed ND: YAG laser tripled in frequency with a repetition rate of 20 Hz. The rotating head of this lidar makes it possible to perform horizontal and vertical scans on a maximum range of 15 to 20 km.
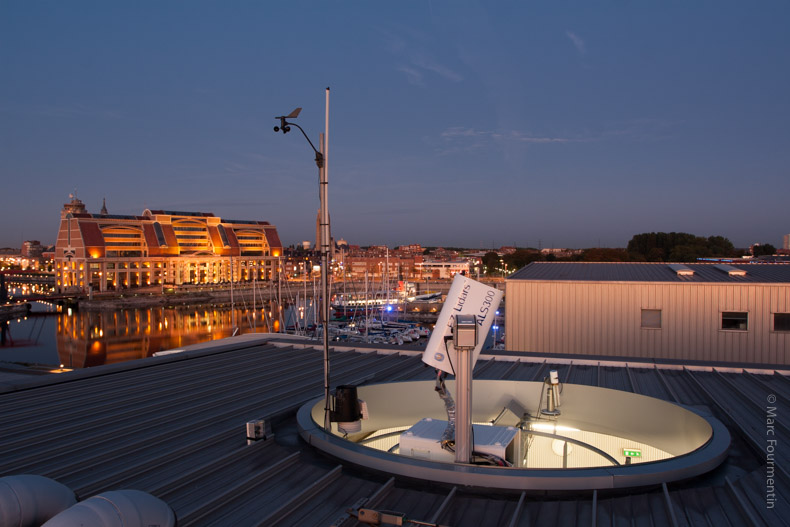
Figure 1: Leosphere ALS300 aerosol lidar in vertical scanning mode
Features of LIDAR aerosol (Leosphere ALS 300):
- Emitter: Laser (Nd-YAG tripled) pumped by flash lamp (20Hz)
- Wavelength: 355 nm (UV)
- Energy (pulse): 16 mJ
- Eye safety: IEC 60825-1
- Divergence: 20 mrad
- Dimensions of the lidar head: 650x356x190 mm
- Weight of the control unit: 45 kg
- Control unit dimension: 820x620x550 mm
- Transfer and control: Network (local / Ethernet)
- Power supply: 230 VAC / 50Hz
Power consumption: 2 kW
Doppler LIDAR WLS 100 (IR)
The WLS 100 Doppler Lidar is an optical instrument for measuring radial wind speed from a laser source (infrared).
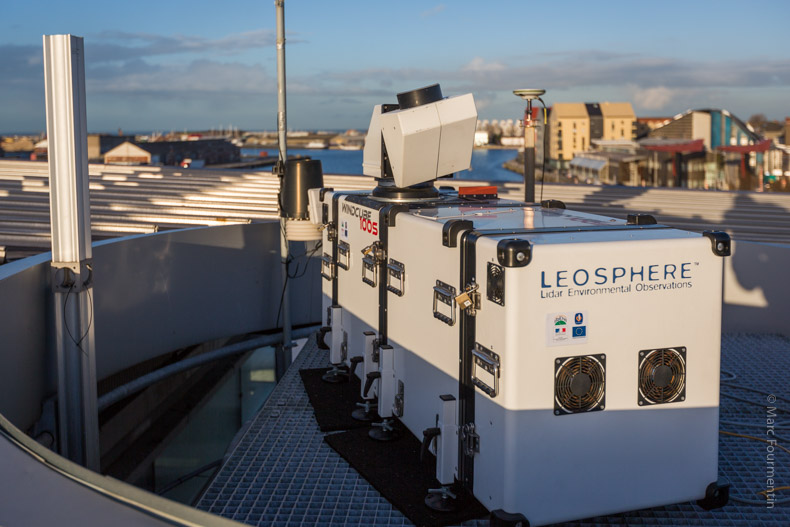
Figure 2: Doppler LIDAR WLS 100.
This device has a range of several kilometers with a spatial resolution of 50 m around the measurement point (figure 3).
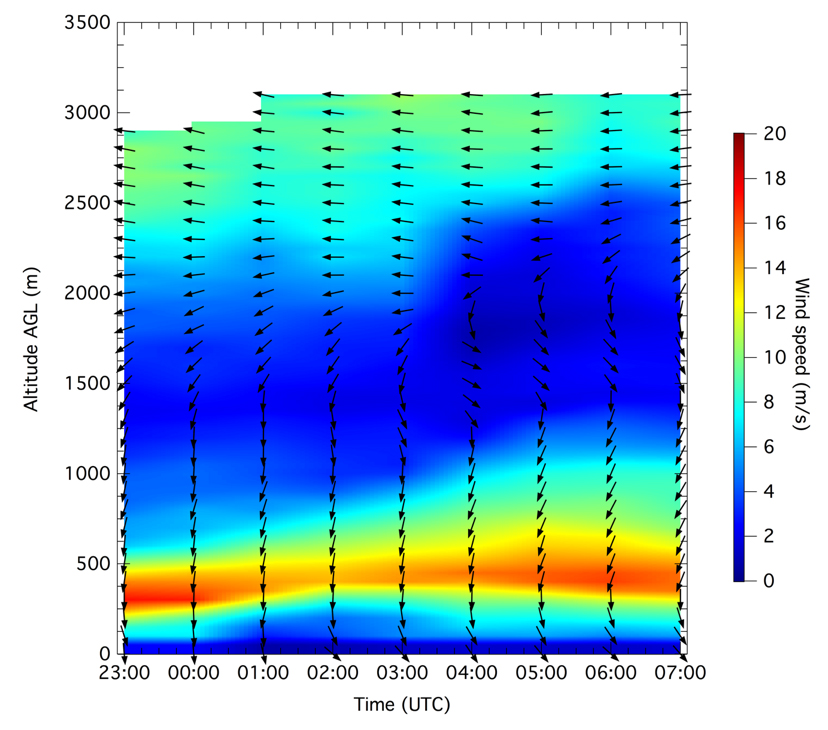
Figure 3 : Time–height section of horizontal wind direction (arrows) and wind speed (color map) deduced from Doppler lidar during 15– 16 April 2015. Leftward and downward arrows represent, respectively, easterly wind and northerly wind (Veselovskii et al., 2015).
Equipped with a periscope, it is used to characterize the vertical profile of the wind (speed, direction, fluctuations etc.) and its spatial distribution by 3D scanning of the laser beam in the troposphere. Its ability to perform rapid measurements (1 second per profile) over several kilometers is suitable for carrying out a study of atmospheric dynamics on a multi-scale aiming to establish phenomenological relationships between local sources, aerosol transport and the dynamics of the air. ‘atmosphere. The analysis of the wind by sweeping represents a very interesting asset making it possible to go back to detailed and precise information on the horizontal and vertical structure of the wind. In addition, the backscattered lidar signal makes it possible to qualitatively map the aerosol charge (see video) and to study the associated meteorological conditions, which may influence, for example, the dispersion and exchanges of aerosols between the atmospheric boundary layer and the free troposphere.
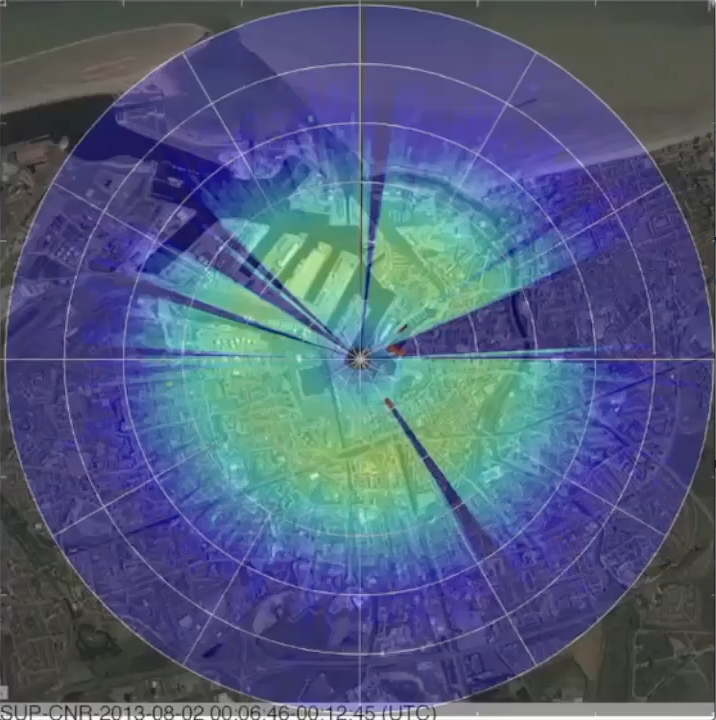
Click on the image to start the video
Sequences of the lidar return signal Plan Position Indicator during a sea breeze day in the industrialized coastal area of Dunkerque (with red colors indicate high aerosol load)
Degreane UHF RADAR PCL1300 (3-pannel version)
The PCL 1300 wind profiler is a pulse Doppler radar. Its main use as a wind tracer is the changes in the refractive index of air created by turbulence. These variations mainly produced by humidity fluctuations in the lower layers, carried by the wind, backscatter part of the energy emitted by the RADAR.
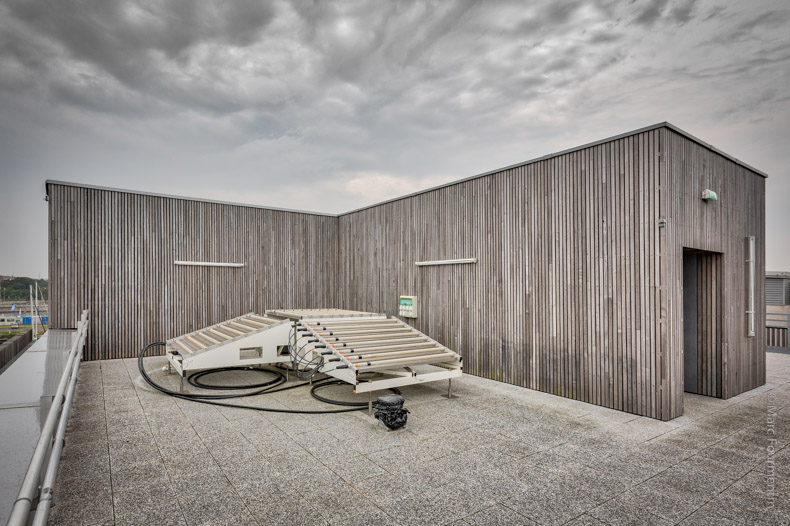
Figure 1: Degreane PCL1300 3-panel UHF RADAR antenna system
Therefore using the reflection properties of electromagnetic waves, the wind profiler provides a vertical profile of the wind, i.e. the measurement of the value of the wind vector at points distributed according to the vertical of the measurement location, at varying altitudes from 75 m to 5 km depending on the power emitted and the atmospheric conditions.
The Doppler measurement associated with the displacement of the turbulence gives the projection of the wind speed in the direction of the antenna lobe. A sequence of shots in at least three independent directions is necessary to reconstruct the wind (calculation of projections u, v, w). The PCL1300 (3 panel version) emits high power pulses in three predetermined directions and receives echoes backscattered by the different layers of the atmosphere. After amplification, appropriate signal processing is applied to result in the development of a vertical wind profile.
Main characteristics :
| Frequency | 900 – 1300 MHz (1274 MHz) |
| Transmitter power | 3,5 kW |
| Antenna gain | 27 dBi |
| Altitude minimum | 75 m* |
| Altitude maximum | 5 km** |
| Resolution (pulse width 500 ns) | 75 m (première porte 75 m) |
| (pulse width 1000 ns) | 150 m (première porte 150 m) |
| (pulse width 2500 ns) | 375 m (première porte 375 m) |
| Intrinsic wind speed accuracy | <1m/s |
| Intrinsic wind direction accuracy | <10° |
| Profile calculation period | Adjustable from 2 minutes |
*depending on environmental conditions, available bandwidth and atmospheric conditionss
**depending on atmospheric conditions and operating mode
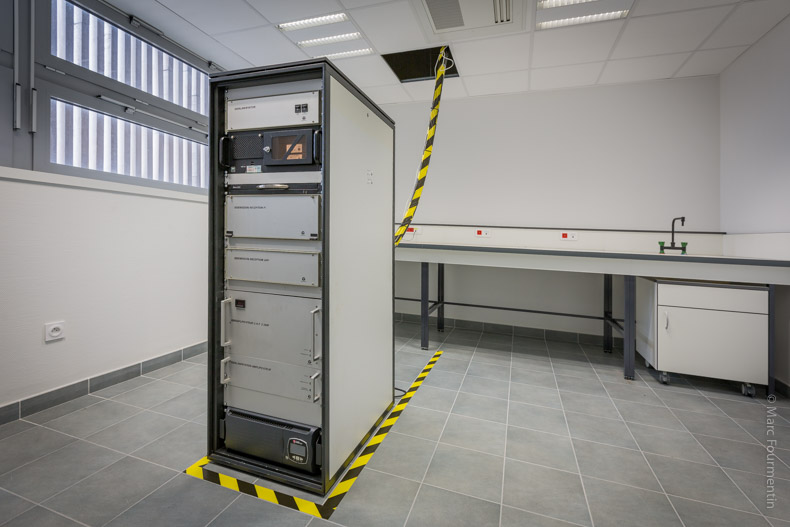
Figure 2: Degreane PCL1300 UHF RADAR transmission / acquisition system
REMTECH SODAR PA2
SODAR (Sound Detection And Ranging), using the Doppler effect, is an active remote sensing instrument dedicated to measuring the vertical profile of the wind. The laboratory is equipped with a 3-component monostatic Doppler SODAR system: the PA2 model from the company Remtech (figure 1).
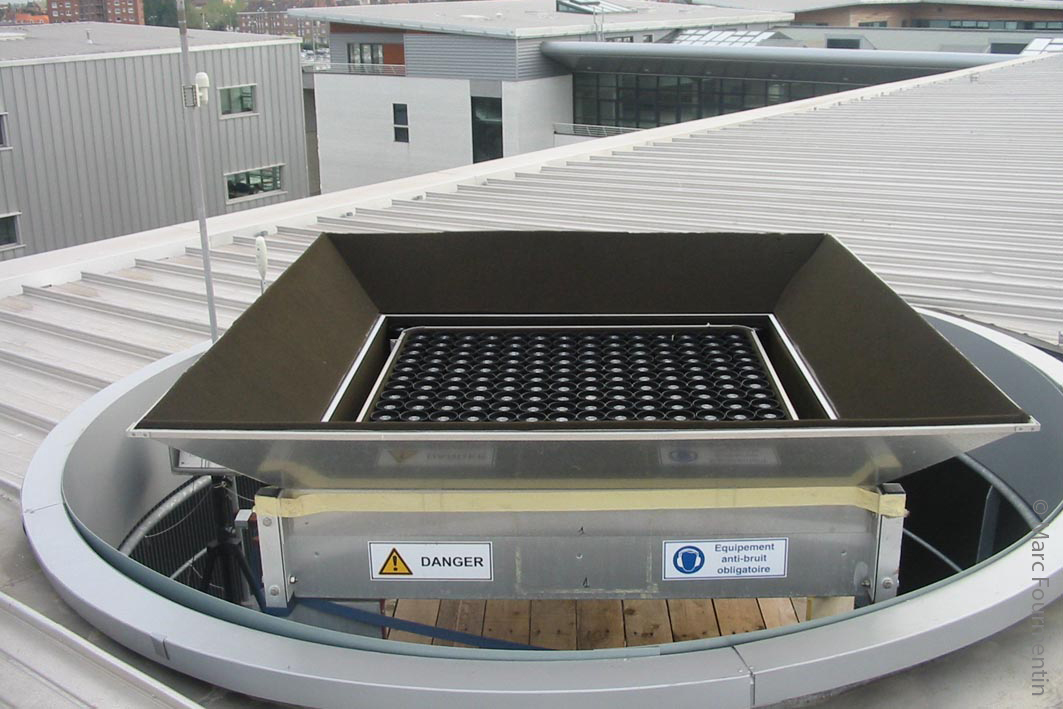
Figure 1 : Remtech SODAR PA2
The single, flat SODAR antenna, phased in different directions, is made up of 196 piezoelectric transducers. It emits short acoustic pulses on a frequency band centered on 2250 Hz with an acoustic power of 10 Watts. Each transducer operates in transmit and receive mode. The signals are emitted along 5 axes (one vertical and the other 4, transverse inclined by 30 °). The 4 transverse axes are every 90 ° in order to achieve the horizontal component of the wind speed. The last beam, oriented vertically, gives the vertical component of the wind speed (Figure 2). The main parameters measured by this instrument are: the speed, the direction as well as the fluctuations of the zonal and southern components of the horizontal wind; the speed and fluctuation of the vertical wind and the intensity of the echo.
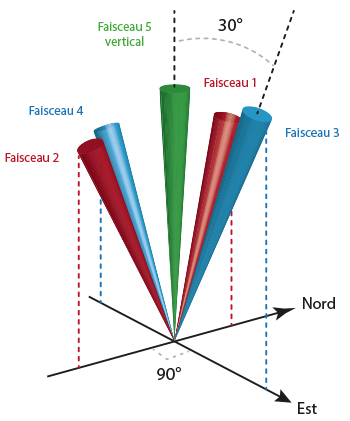
Figure 2 : SODAR emission beams
Figure 3 is an example of time-height sections of parameters from SODAR measurements on the Dunkirk tide gauge site.
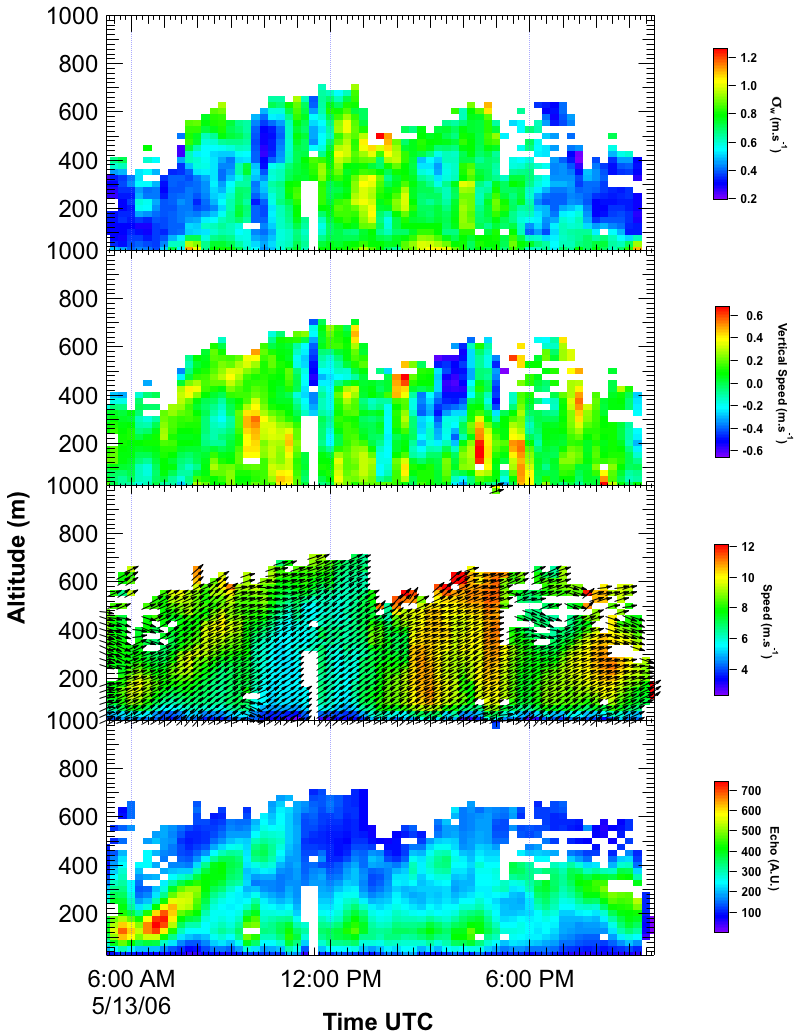
Figure 3 : Time-height sections of echo, horizontal velocity and direction, vertical velocity and vertical component fluctuations
The minimum measurement altitude is 20 m and the maximum altitude is 700 m under the measurement conditions encountered during our measurement campaigns. Indeed, the performance and range of the measurements can be altered by ambient noise if the sound sources produce a signal that covers the frequency band used by the SODAR. The results are averaged with a spatial resolution chosen in an interval of 10 to 200 m, and in a time lapse which varies between 2 minutes and 1 hour.
Ultrasonic Anemometers
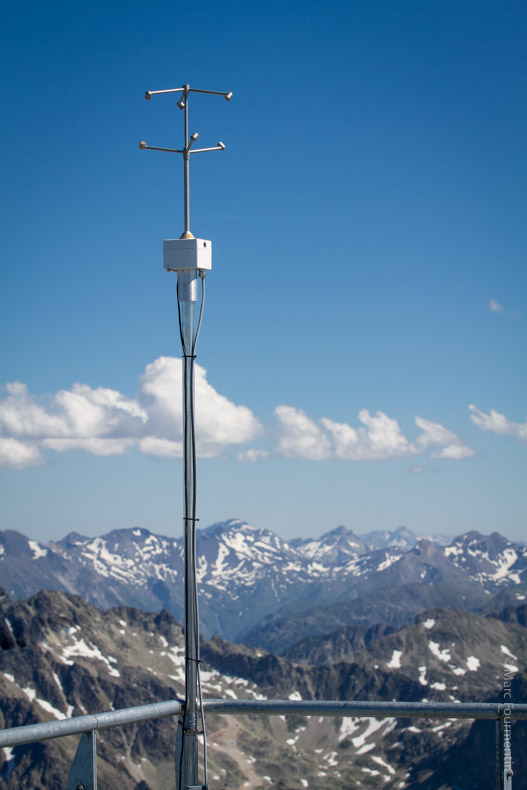
Figure 1 :METEK USA-1 ultrasonic anemometer (Pic du Midi)
It is made up of 3 pairs of transducers separated by a distance L of approximately 1750 mm and measures, alternately in one direction and the other, the transit time of ultrasonic pulses (20 kHz) from a transducer to the ‘other (Figure 2).
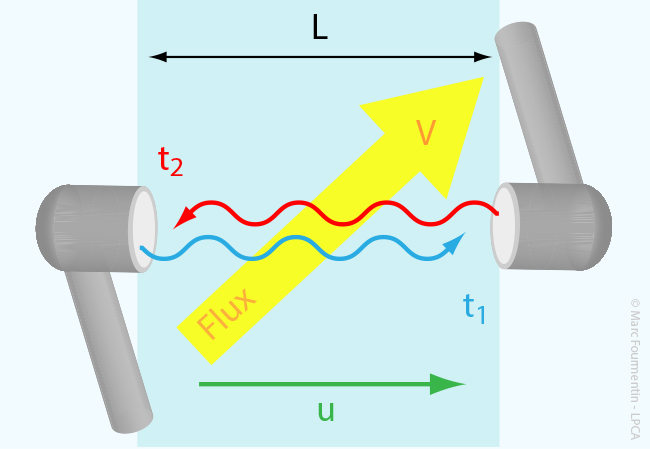
Figure 2 : Ultrasonic anemometer working principle
The transducer (functioning as a transmitter) emits an ultrasonic pulse whose time of flight to reach the opposite transducer (functioning as a receiver) is t1. The right transducer (functioning as a transmitter this time) then emits an ultrasonic pulse whose flight time to reach the left transducer (functioning as a receiver) is t2. We then have:
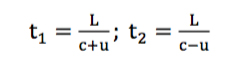
where it is the speed of sound, m / s and u is the speed of the wind, m / s.
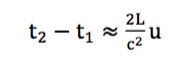
The wind speed is determined by the difference in flight times considering that the wind speed is much lower than that of sound:
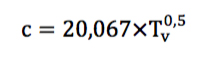
The ultrasonic anemometer also makes it possible to determine the virtual temperature Tv, the speed of sound being a function of the temperature:
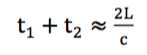
The speed of sound can also be deduced from the sum of the flight times:
Accessible physical parameters
From the measurement at a high frequency (20 Hz) of the time of flight in 3 directions, the ultrasonic anemometer makes it possible to determine the 3 components of wind speed, direction and temperature. The calculation of wind and temperature covariances gives access to sensible heat fluxes and momentum, as well as the Monin-Obukhov length. The following table gathers the physical parameters accessible by the ultrasonic anemometer. Among all these parameters, we will focus on those more or less associated with the dispersion of atmospheric pollutants. For example, σu, σv and σw because they determine the vertical and horizontal components of the TKE.